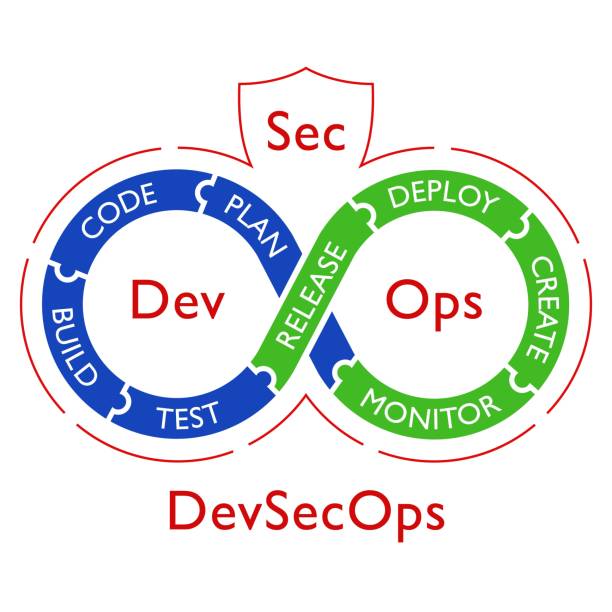
Advanced DevOps Training Course in Gurgaon
Monitor & Observe your Applications & Infrastructure using Grafana, Prometheus, Dynatrace, Datadog, Zabbix & other tools . These tools collect time-series metrics like CPU & memory using Telemetry, Influx DB & others then visualize them on customized dashboards in form of graphs & bar charts. We can also bring insights this time-series data using PromQL that will help to filter out or aggregate metrics streams for a particular time range . Dynatrace on the other hand is very powerful for monitoring of cloud infrastructure.
- Develop time-series pipeline based on Grafana, Prometheus, Influx DB, Dynatrace, Datadog , Zabbix & other to monitor & observe our applications & infrastructure.
- Training program will provide interactive sessions with industry professionals
- Realtime project expereince to crack job interviews

- Course Duration - 3 months
- Get training from Industry Professionals
Train using realtime course materials using online portals & trainer experience to get a personalized teaching experience.
Active interaction in sessions guided by leading professionals from the industry
Gain professionals insights through leading industry experts across domains
24/7 Q&A support designed to address training needs
Advanced DevOps Training Course Overview
Shape your carrer in Application & Infrastructure monitoring with certification in Grafana, Prometheus, Dynatrace, Datadog, Zabbix & others. This training helps to understand how to monitor & Observe your Applications & Infrastructure using Grafana, Prometheus, Dynatrace, Datadog, Zabbix & other tools . These tools collect time-series metrics like CPU & memory using Telemetry, Influx DB & others then visualize them on customized dashboards in form of graphs & bar charts. We can also bring insights this time-series data using PromQL that will help to filter out or aggregate metrics streams for a particular time range . Dynatrace on the other hand is very powerful for monitoring of cloud infrastructure.
- Benefit from ongoing access to all self-paced videos and archived session recordings
- Success Aimers supports you in gaining visibility among leading employers
- Industry-paced training with realtime scenarios using Monitoring & Observability tools (Grafana, Prometheus, Dynatrace, Datadog, Zabbix & others) for infrastructure & application monitoring & Observability
- Real-World industry scenarios with projects implementation support
- Live Virtual classes heading by top industry experts alogn with project implementation
- Q&A support sessions
- Job Interview preparation & use cases


Explain Grafana & Prometheus Engineers?
Grafana & Prometheus Engineers monitor Infrastructure using monitoring & observability tools while tracing Infrastructure and network metrics & logs. Grafana, Prometheus, Dynatrace, Datadog capture performance metrics from infrastructure on Hybrid Cloud platforms (AWS, Azure, GCP & others) & integrate it with DevOps pipelines to capture infrastructure metrics & logs at runtime to trace unusual & false patterns if any. These templates will be integrated to the DevOps pipeline to get infrastructure traces.
Role of Infrastructure (Monitoring) Engineer?
Infrastructure Monitoring Engineers monitor Infrastructure using tools like Grafana, Prometheus Dynatrace, Datadog, Zabbix & others by integrating it with Cloud Infrastructure (AWS, Azure, GCP & others) to get the network servers ,metrics, logs & other details.
Responsibilities include:
- Infrastructure Monitoring Engineers use Visual Studio & others IDE’s to write Grafana & Prom SQL scripts to monitor infrastructure.
- Grafana & Prometheus Engineers monitors the end-to-end Infrastructure using monitoring workflow and templates.
- Develop and Design monitoring workflows that trace cloud infrastructure securely & seamlessly
- Success Aimers helps aspiring Infrastructure Monitoring professionals to build, monitor cloud environments using Grafana & Prometheus templates effectively & seamlessly.
- Deploying Grafana & Prom QL scripts within cloud infrastructure securely & seamlessly.
Who should opt for Infrastructure (Monitoring) Engineer course?
Infrastructure (Monitoring) Engineer course accelerates/boost career in DevOps & Cloud organizations.
- Infrastructure (Monitoring) Engineers – Infrastructure (Monitoring) Engineers monitors the end-to-end Infrastructure life cycle using Grafana & Prometheus workflow and dashboards templates.
- DevOps Engineers – Implementing Monitoring Pipelines using CI/CD & monitoring Tools.
- Infrastructure (Monitoring) Engineer – Automated Monitoring workflows using CI/CD & Monitoring Tools (Grafana, Datadog & others)
- DevOps Architect – Leading DevOps initiative within enterprise.
- Cloud and Infrastructure Engineers – Monitor Application using DevOps automation & monitoring tools including Grafana, Prometheus, Dynatrace & others across environments seamlessly and effectively.
Prerequisites of Infrastructure (Monitoring) Engineer Course?
Prerequisites required for the Infrastructure (Monitoring) Engineer Certification Course
- High School Diploma or a undergraduate degree
- Python + JSON/YAML scripting language
- IT Foundational Knowledge along with DevOps and cloud infrastructure skills
- Knowledge of Cloud Computing Platforms like AWS, AZURE and GCP will be an added advantage.
Kind of Job Placement/Offers after Infrastructure (Monitoring) Engineer Certification Course?
Job Career Path in Infrastructure(Cloud) Automation using Monitoring tools.
- Infrastructure (Monitoring) Engineer – Develop & Deploying Grafana scripts within cloud infrastructure using Prometheus , Datadog & similar tools.
- Infrastructure (Monitoring) Engineer – Design, Developed and build Monitoring workflows to drive key business processes/decisions.
- DevOps Architect – Leading DevOps initiative within enterprise.
- DevOps Engineers – Implementing DevOps Pipelines using CI/CD & Infrastructure & Monitoring Tools.
- Cloud and Infrastructure Engineers – Deploying Monitoring Application using DevOps automation tools including Grafana across environments seamlessly and effectively.
| Training Options | Weekdays (Mon-Fri) | Weekends (Sat-Sun) | Fast Track |
|---|---|---|---|
| Duration of Course | 2 months | 3 months | 15 days |
| Hours / day | 1-2 hours | 2-3 hours | 5 hours |
| Mode of Training | Offline / Online | Offline / Online | Offline / Online |
Advanced DevOps Course Curriculum
Shape your carrer in Application & Infrastructure monitoring with certification in Grafana, Prometheus, Dynatrace, Datadog, Zabbix & others. This training helps to understand how to monitor & Observe your Applications & Infrastructure using Grafana, Prometheus, Dynatrace, Datadog, Zabbix & other tools . These tools collect time-series metrics like CPU & memory using Telemetry, Influx DB & others then visualize them on customized dashboards in form of graphs & bar charts. We can also bring insights this time-series data using PromQL that will help to filter out or aggregate metrics streams for a particular time range . Dynatrace on the other hand is very powerful for monitoring of cloud infrastructure.
Docker and Kubernetes Certification Course (CKAD & CKA)
Discover how we can containerize our WebApps using container technology like Docker & orchestrated containers using Kubernetes engine that combine the advantages of DevOps & infrastructure automation capabilities. Understand K8s role within your cloud data ecosystem and leverage its scaling and IAAC capabilities to automate cloud infrastructure . Explore how Docker & K8s products and features empower all DevOps practitioners to develop cloud auto-driven solutions tailored to infra automation requirements

Grafana: Observability, Monitoring, Alerts
Course Details - Grafana: Observability, Monitoring, Alerts
Introduction to Grafana
- Meet Grafana: The Artist of Metrics & Logs
- Why use Grafana? Key Features, Benefits and Comparisons
- Installing & Setting Up Grafana Across Environments
Grafana Configuration & Administration
- Grafana Basic Configuration
- Dashboard Construction Process and Components
- Creating a Dashboard with Grafana Using Test Data
Start Playing with Realtime Dashboards
- Learn How to Install Plugin in Grafana
- Create a Data Source for CSV Data
- Build Dashboards for CSV Data
- Build Dashboards for CSV Data II
Transformations in Grafana
- Transformations in Grafana
- Apply Transformation on Data I
- Apply Transformation on Data II
- Real-Time Server State Visualization
Visualizing Time Series Data in Grafana
- Introduction to Time Series Visualization
- Create a Time Series dashboard
- Create a Time Series dashboard II
Database Monitoring with Grafana: MySQL
- SetUp the Machine and Install MySQL Server
- SetUp the MySQL DB for Grafana Monitoring
- SetUp Grafana Datasource for MySQL DB Monitoring
- Prepare MySQL Grafana Dashboard I
- Prepare MySQL Grafana Dashboard II
- Prepare MySQL Grafana Dashboard III
- Put Load on DB: Observability in Grafana Dashboard
Log Monitoring Grafana: Loki & Promtail
- Purpose of Loki & Promtail
- Install and Configure Loki
- Install and Configure Promtail
- LogQL Basics: Stream Selectors Explained
- Advanced Log Filtering with LogQL
- Grafana Dashboard for MySQL Logs
Visualize Data with Reports
- The 3 Key Questions
- Dashboard Design Framework
- Sketching the Dashboard Layout
- Adding Report Pages & Objects
- Naming & Grouping Objects
- Cards & Multi-Row Cards
- Building & Formatting Charts
- Line Charts
- Trend Lines & Forecasts
- Line Chart & Trend
- KPI Cards
- Bar & Donut Charts
- Basic Filtering Options
- Donuts & Filters
- Table & Matrix Visuals
- Conditional formatting
- Top N Filtering
- Tables
- Top N Text Cards
- Map Visuals
- Report Slicers
- ASSIGNMENT: Slicers
- PRO TIP: HASONEVALUE
- Gauge Charts
- PRO TIP: Advanced Conditional Formatting
- Area Charts
- Drill Up & Drill Down
- Drill through Filters
- Editing Report Interactions
- Report Interactions
- Adding Bookmarks
- Custom Navigation Buttons
- Slicer Panels
- Numeric Range Parameters
- Fields Parameters
- Custom Tool Tips
- Importing Custom Visuals
- Managing & Viewing Roles
- Mobile Layouts
- Publishing to Power BI Service
- Data Visualization Best Practices
Grafana + InfluxDB Mastery: RealTime Monitoring with Telegraf, Flux& FluxQL
- What is InfluxDB? A Beginner’s Guide to Time-Series Databases
- How to Download & Prepare InfluxDB 3 for Setup
- Installing InfluxDB Locally
- Getting Started with InfluxDB 3 Core
- Data Ingestion in InfluxDB 3 Core
- Talk to Your Data: Querying InfluxDB
- Use the InfluxDB HTTP API to Write Data
- Integrate Grafana with Influx DB
- Install and Configure Telegraf
- Configure Multiple Servers with Telegraf
- System Pulse: Real-Time Health & Performance Dashboard
- Create Dynamic Dashboard for Multi Node Monitoring
- System Pulse: In Depth Real-Time Health & Performance Dashboard
Monitor & Observe your Applications & Infrastructure using Grafana . These tools collect time-series metrics like CPU & memory using Telemetry, Influx DB & others then visualize them on customized dashboards in form of graphs & bar charts. We can also bring insights this time-series data using PromQL that will help to filter out or aggregate metrics streams for a particular time range . It uses interactive Data visualization and Monitoring dashboards will help users to create dynamic dashboards to visualize metrics, logs, and traces collected from servers (Application, Databases & others).

Prometheus: Monitoring & Alerting
Monitor & Observe your Applications & Infrastructure using Grafana . These tools collect time-series metrics like CPU & memory using Telemetry, Influx DB & others then visualize them on customized dashboards in form of graphs & bar charts. We can also bring insights this time-series data using PromQL that will help to filter out or aggregate metrics streams for a particular time range . It integrates with Grafana that will generate interactive Data visualization and Monitoring dashboards & it help users to create dynamic dashboards to visualize metrics, logs, and traces collected from servers (Application, Databases & others) . Prometheus uses Prom QL (a query language tool of Prometheus) to bring insights from the collected metrics & aggregate them for analytical purpose.

Course Details - Prometheus: Monitoring & Alerting
Introduction
- Introduction to Prometheus
- Alternate Monitoring Tools
- Basic Terminologies in Prometheus
Architecture of Prometheus Server
- Architecture of Prometheus
- How Prometheus Works behind the scenes (Life Cycle)
Installation & UI Tour
- Virtual Machine Installation
- Prometheus Installation
- First Look of Prometheus UI
- Understanding Prometheus Configuration File
- Prometheus First Run
Exporters – Set 1
- What are Exporters?
- Node Exporter – Monitoring Linux Systems
PromQL – Prometheus Query Language
- Data Types in PromQL
- Selectors & Matchers
- Binary Operators
- ‘ignoring’ and ‘on’ keywords
- Aggregation Operators
- Functions – ‘rate’ & ‘irate’
- Functions – changes, deriv, predict_linear
- Functions continued
Client Libraries – Adding Instrumentation to Python Application
- What are Client Libraries and Metric Types
- Python app Boilerplate Code
- Exposing Metrics from Python app using Prometheus Client
- Counter Metrics Exposition
- Adding Labels to Exposed Metrics
- Gauge Metrics Exposition
- Summary Metrics Exposition
- Histogram Metrics Exposition
Client Libraries – Instrumenting GO Applications
- GO app Boilerplate Code
- Counter Metrics Exposition
- Gauge Metrics Exposition
- Summary Metrics Exposition
- Histogram Metrics Exposition
Quantification of Instrumentation
- What to Instrument?
- How much to Instrument?
Recording Rules
- What are Recording Rules?
- Reload Prometheus Configurations on-the-fly
- Writing Recording Rules
- Writing Recording Rules continued
- Add Multiple Rules
- Best Practices for Recording Rules
Alerting
- What is Alerting?
- Writing & Firing the first Alert
- ‘for’ clause
- Adding Labels to Alerts
- Installing Alertmanager
- Adding Alert Notifier – Gmail
- Sending Alert Notifications – Gmail
- Templating the Alerts
Create Routing Tree for Alerts – Case Study
- Case Study – Problem Statement
- Understanding the Use Case for Routing Tree
- Write Alerting Rules for the Use Case
- Coding the Routing Tree – Part 1
- Coding the Routing Tree – Part 2
- Coding the Routing Tree – Part 3
- Run the Routing Tree
- Grouping the Alerts
- Throttling the Alerts
- Inhibiting the Alerts
- Silencing the Alerts
- ‘continue’ clause
PagerDuty & Slack – Alert Notifiers
- Slack integration with Prometheus
- PagerDuty integration with Prometheus
Blackbox Exporter & Relabeling
- What is Blackbox exporter
- Download Blackbox exporter
- ‘http’ probe module
- ‘tcp’ & ‘icmp’ probe module
- ‘dns’ probe module
- Scraping targets via Blackbox
- Relabelling
Pushgateway
- Introduction to Pushgateway
- Getting Started with Pushgateway
- Push metrics to Pushgateway
- Automate Pushing metrics using Cron job
- Python App pushing metrics to Pushgateway
- Pushgateway Pitfalls
Service Discovery
- Introduction to Service Discovery
- Static Service Discovery
- File-based Service Discovery
Amazon Cloud with Prometheus
- Create Prometheus User in AWS
- Spinning up AWS EC2 instance
- Node Exporter on EC2 instance
AWS Cloudwatch Exporter
- AWS Cloudwatch & UI tour
- Installation & Configuration
- Running the Cloudwatch Exporter
Prometheus HTTP API
- Running Prometheus with HTTP API
Grafana Dashboards
- Grafana Installation
- Adding Data source to Grafana
- Implementing default dashboards of Grafana
- Create Custom Dashboard – Part 1
- Create Custom Dashboard – Part 2
Grafana & Prometheus Stack
Course Details - Grafana & Prometheus Stack
Collecting Metrics from Unix, Linux and Mac
- Overview of Scraping and Push Gateway
- Node Exporter Part 1
- Node Exporter Part 2
- Node Exporter Part 3
- Running Node Exporter as a Service on Ubuntu
- Installind Node Exporter on Mac with Home Brew
Collecting Metrics from Windows
- Collecting Metrics with WMI Exporter
Collecting Metrics
- Data Model of Prometheus
- Data Types in Prometheus
- Binary Arithmetic Operators in Prometheus
- Binary Comparison Operators in Prometheus
- Set Binary Operators in Prometheus
- Matchers and Selectors in Prometheus
- Aggregation Operators
- Time Offsets
Functions in Prometheus
- Clamping and Checking Functions
- Delta and iDelta
- Sorting and TimeStamp
- Aggregations Over Time
Alerting
- Alerts overview
- Defining Alert Rules
- Defining a Time Threshold
- Labels, Annotations, and Templates
- What is Alert Manager?
- Installing Alert Manager on Windows
- Receivers in Alert Manager
- Routes in Alert Manager
- Integrating Alert Manager with Slack
- Integrating Alert Manager with PagerDuty
- Inhibiting and Silencing Notifications
Recording Rules in Prometheus
- Introduction to Recording Rules
- Writing a recording rule with “rate” function
Client Libraries of Prometheus and Short-Lived Jobs
- Introduction to Client Libraries
- Using the Python client library – the Summary metric
- Using the Python client library – Counters and Gauges
- Using the Python client library – Labels
- Using the Java client library
- Using the .NET (dotnet) client library – Part 1
- Using the .NET (dotnet) client library – Part 2 – Labels
- Using the .NET (dotnet) client library in ASP.NET Core
Introduction to Service Discovery and Push Gateway
- Introduction to Service Discovery and Push Gateway
Service Discovery
- Service Discovery Options in Prometheus
- Service Discovery in AWS (EC2 and LightSail) – Part 1
- Service Discovery in AWS – Example and Case Study
- File-based Service Discovery
Push Gateway
- Installing PushGateway on Windows and Mac
- Sending Metrics to PushGateway with Python
- Sending Metrics to PushGateway with Java
- Sending Metrics to PushGateway with Dotnet
Security in Prometheus
- Introduction to Authentication Methods in Prometheus
- Basic Authentication in Prometheus
- Enabling HTTPS for Improved Security
- Enabling HTTPS on Exporters i.e. Node Exporter
- Securing PushGateway
- Connecting to Push Gateway Securely
- Securing Alert Manager
Grafana Installation and Introduction
- What is Grafana?
- Cloud or On-Premises?
- Installing Grafana on Windows
- Installing Prometheus & Grafana Stack with Docker
- Configuring Grafana
Using Grafana – Connecting and Creating Dashboards
- Dashboard Design Best Practices
- The ShoeHub Global Company!
- Connect Grafana to Prometheus
- Creating and Managing Dashboards
- Creating Your First Panel : The Time Series Panel
- Multiple and Accumulative Queries
- Exercise: Display Country Data on A Graph Panel
- Data Transformations
- Visually Comparing Values with Pie Charts
- Comparing Metric Data of Two Different Times (Time Shift)
- Practice : Working with Charts and Thresholds
- Thresholds in Grafana
- Variables and Dynamic Dashboards
Collecting and Processing Logs with Grafana
- About Grafana Loki
- Options of Using Grafana Loki (Cloud vs. On-Prem)
- Installing Grafana Loki with Docker
- Installing Loki and Promtail on Linux (Ubuntu)
- Ingesting Log Entries into Loki using Promtail
- Creating and Attaching Static Labels
- Dynamic Labels: Extracting Labels from Unstructured Logs
- Visualizing Loki Queries on Dashboards
Grafana Alloy for Logs and Opentelemetry Signals
- Introduction to Telemetry (OTel)
- The Architecture of Open-Telemetry
- Prometheus Remote Write for OTel Metrics
- Introduction to Grafana Alloy
- Installing and Configuring Grafana Alloy on a Mac Computer
- Configuring Grafana Alloy to Receive, Process and Export
- Opentelemetry Signals
- Sending Metrics from a Microservice to Grafana Alloy and Prometheus
- Shipping Logs to Loki with Alloy
- Installing Grafana Alloy on Ubuntu
Grafana Mimir – Observability at Scala
- About Grafana Mimir
- Deploying Mimir in Monolithic Mode
- Sending and Receiving Metrics of Multiple Tenants
- Configuring Mimir’s Backend and Common Storages with AWS S3
- Deploying Mimir in Microservices Mode
- Installing Minikube for Locally Deploying Mimir in Microservice Mode
- Deploying Grafana Mimir to Kubernetes using Helm
- Introduction to Alert Management with Mimir
- Configuring Ruler, Alert Manager and Mimir for Alerting
- Mimirtool for Configuring Alert Manager
Alerts in Grafana
- About Alerts in Grafana
- Working with Alert Rules
- Notification Policies and Contact Points
- Sending Alert Notifications to Slack
- Silencing Alert Notifications
- Annotations
Using AI to Power Observability
- Application of AI in Grafana Cloud and Grafana OSS
- Effective Prompt Engineering to Bolster Observability with AI
- Using Plugins to use AI in Grafana Effectively
Administration of Grafana
- Overview of Administration in Grafana
- Working with Organizations, Teams and Users in Grafana
- Active Directory Authentication for Grafana
- Google Authentication for Grafana
Highly Available and Scalable
- Deploying Grafana for High Availability (HA)
- Deploying Grafana for Scalability
Grafana & Prometheus Stack combined monitor & Observe your Applications & Infrastructure using Grafana . These tools collect time-series metrics like CPU & memory using Telemetry, Influx DB & others then visualize them on customized dashboards in form of graphs & bar charts. We can also bring insights this time-series data using PromQL that will help to filter out or aggregate metrics streams for a particular time range . Prometheus integrates with Grafana to generate interactive Data visualization and Monitoring dashboards that will help users to create dynamic dashboards to visualize metrics, logs, and traces collected from servers (Application, Databases & others).Prometheus integrates with Grafana that will generate interactive Data visualization and Monitoring dashboards & it help users to create dynamic dashboards to visualize metrics, logs, and traces collected from servers (Application, Databases & others) . Prometheus uses Prom QL (a query language tool of Prometheus) to bring insights from the collected metrics & aggregate them for analytical purpose.

Datadog Monitoring – Performance Monitoring Tool
Course Details - Datadog Monitoring – Performance Monitoring Tool
Introduction
- Introduction to Monitoring in SDLC
- What is Datadog monitoring tool
- Key functionalities of monitoring tools
- Monitoring Terminologies
- Architecture of Datadog
Datadog : Registration, Pricing and Agent Installation
- Datadog Pricing
- Datadog Setup and account creation
- Registration and Agent installation
Datadog Agent: Definitions, Configurations and Integrations
- Datadog Agent Manager
- Datadog Agent’s Directory Tour
- Datadog Agent Manager continued
- Datadog Agent – definitions and configurations
- Datadog Agent – display host basic metrics and default host dashboards
- Datadog Agent – integration with Internet Information Server (IIS)
Tags in Datadog
- Introduction to Tagging
- Unified Service Tagging (Reserved Tags) in Datadog
- Filtering, Grouping on Tags
- Assigning Tags from datadog.yaml file
Datadog Infrastructure: Host Maps and Infrastructure List
- Datadog Infrastructure: Host maps and Infrastructure List
Infrastructure Monitoring - Processes
- Process Explorer – Part 1
- Process Explorer – Part 2
- Scrubbing Sensitive data
- Create Custom Process metrics
Infrastructure Monitoring - Containers
- Introduction
- Docker Setup
- Containerized Docker Agent Setup
- Container Map and Live Containers
- Realistic approach to run Docker agent
- Environment Variables Translation rules
- Run Docker Agent from Docker Compose file
Datadog Metrics: Explorer, Summary, Metric Types and Metrics Views in Datadog
- What are Metrics?
- Why Datadog Agent aggregates metrics
- Count, Rate, Gauge, Set Metric types
- Histogram Metric type
- Distribution Metric type
- Datadog’s Summary View for Metrics
- Metric Explorer
- Metrics Summary and Metrics Types
Custom Metrics Agent Check
- Custom Metrics Fundamentals
- Custom Metrics submission types
- Create Custom Check for COUNT metric type
- Custom Agent check running
- Metric Without Limits
- Create Custom Check for GAUGE metric type
- Create Custom Check for RATE metric type
- Create Custom Check for HISTOGRAM metric type
Custom Metrics – DogStatsD & PythonApp
- Python application code to instrument
- increment() & decrement() functions for COUNT metric type
- Instrument Python app for COUNT metric type
- Instrument Python app for GAUGE metric type
- Instrument Python app for HISTOGRAM & DISTRIBUTION
Events
- Introduction to Events
- Event Log Check to capture Windows Events
- Create Custom events
- Event Explorer
Notebooks
- Create notebook – Add Timeseries Cell
- Add Text, Table cells in notebook
- Notebook Settings
- Notebook Templates
Dashboards
- Introduction to Dashboards
- Timeseries widget
- Find Correlations in metrics
- Query values, Table, Top list widgets
- Groups, Annotations, Summaries, List, Stream widgets
- Template Variables
- Dashboard Settings
Monitoring & Alerts
- Create Host Monitor
- Tag, Template, Conditional Variables
- Draft Notification messages
- Draft Renotification message
- EVAL function
- Trigger Monitor & Test notifications
- Manage Monitors View
- Downtime
Log Collection
- Introduction to Datadog’s Log Management
- Configurations required to collect logs from Python App
- Python application to generate logs
- Containerized Log collection
Logs Preprocessing – Datadog Log Pipelines
- Introduction to Log pipelines
- Create Custom Processor in Pipeline using Grok Parser
- Create Custom Pipeline
- Standard Attributes
- Generate Log based metrics
- Create Custom Index
- Exclusion Filter in an Index
- Archive Logs to Google Cloud
- Log Rehydration
Logs Explorers
- Live Tail view
- Group logs by Fields, Patterns, Transactions
- Create Facet in Facet panel
- Create Measure in Facet panel
Datadog Integrations
- Datadog Integrations Types
- Supported Datadog Integrations with default Dashboards
Datadog Application Performance Monitoring (APM) – Instrument Flask App (Download, Installation, Services, Traces and Error Tracking)
- Understanding Flask application
- What are Traces & Spans
- APM Setup & Configuration
- Run app with ddtrace instrumentation
- APM will monitor our DogsWorld application based on .NET Core
- APM – download, installation and basic configuration (Windows)
- APM Services and Service Map
- APM Traces – Transactions, Basic search, Search pane and Facets
- APM Traces – Flame graph, Span list and System Tags
- APM Traces – Error Tracing
- APM – Profiling
Datadog APM – Custom Tags, Exception Handling and Facets
- APM – Custom Tags and Sending custom tags using .NET Tracer Nuget Package
- APM – Custom Tags, Search, Filter and Facet usage
Datadog Dashboards – Create (with Graphs), Import, Export and Variable Usages
- Dashboard List and Definitions
- Dashboard – Create a New Dashboard with many Widgets
- Dashboard – Import widgets/graphs into Dashboard from Services and Metrics Page
- Dashboard – Import and Export as JSON
- Dashboard – Variables usage
APM – Trace Pipeline
- Introduction to Trace pipeline
- Sampling – Agent & Library level
- Trace Metrics
- Sever side components of Trace pipeline
- Ingestion Control – Usage Dashboard
- Ingestion Control – Manage Agent & Library Sampling
- Ingestion Control – Library Sampling
- Ingestion Control – Custom metrics & Retention filters
APM Views and Explorers
- Live Search
- Trace View – Flame graph, Span list, Dependency Map
- Introduction to Service Catalog
- Service catalog – Ownership, Reliability, Performance, Security views
- Service page
- Resource page
- Deployments tab & Service Map view
- Instrument application for Error Tracking
- Error Tracking page
- Connect Traces to Logs
- Service Registration
Continuous Profiling
- Instrumentation for Profiling
- Endpoint Profiling & Code hotspots
Datadog Monitors (Alerts) and Notifications by Email, Slack and PagerDuty
- Monitors – Create Monitors
- Monitors – Suggested Monitors
- Monitors – Management
- Monitors – Integration with Slack
- Pager Duty – Account Creation
- Monitors – Integration with Pager Duty
UI Monitoring
- Introduction to Real User Monitoring (RUM)
- Instrument application for RUM
- Event types collected by RUM
- Customize & Enrich RUM data
- Session & Replays
- View Panel
- Dashboards and Generate Custom RUM Metrics
Datadog: SLA, SLO, SLI and Error Budget (DevOps)
- Datadog – SLA, SLO, SLI and Error Budget (DevOps)
- Datadog – SLO Creation, Date Correlation and Setup Alerts
Synthetic Monitoring: API Tests and Browser Tests
- What is a Synthetic Monitoring
- Create API Tests
- Create Browser Tests
Datadog Account Management for Admins
- Personal Settings
- Organization settings
- SAML Group mappings
- API and Application keys
- Login methods
- Audit Trail
- Sensitive data scanner
- Plan and usage
- Account Collaboration
Log Management: Basics, Log Entries, Log Exceptions, NLog usage
- What is a Log Management System
- How to Log Data using NLog
- Log Explorer and Log Exceptions
NodeJS and MongoDB Application monitoring in Datadog
- Setup NodeJS application with MongoDB locally from GitHub
- Configure NodeJS Custom Metrics
- Configure NodeJS Services and Traces
- NodeJS and MongoDB Service Catalog
- NodeJS Traces
Datadog is used for performance monitoring of our application & infrastructure . These tools collect time-series metrics like CPU & memory using Telemetry, Influx DB & others then visualize them on customized dashboards in form of graphs & bar charts. We can also bring insights this time-series data using PromQL that will help to filter out or aggregate metrics streams for a particular time range . It uses interactive Data visualization and Monitoring dashboards will help users to create dynamic dashboards to visualize metrics, logs, and traces collected from servers (Application, Databases & others).

Zabbix Application and Networking Monitoring
Zabbix is a also monitoring tool to create Data Visualization & create realtime bar graphs & charts
from network, infrastructure and application deployed within the environment. It Monitor & Observe your Applications & Infrastructure & generated visualization. Zabbix tool collect time-series metrics like CPU & memory using Telemetry, Influx DB & others then visualize them on customized dashboards in form of graphs & bar charts. We can also bring insights using time-series data collected from various sources & aggregate metrics streams for a particular time range .

Course Details - Zabbix Application and Networking Monitoring
- Provisioning a Linux to Install Zabbix Server
- Download and Install The Zabbix Repository
- Create the Initial Database
- Log in and Configure Zabbix Server Front End
- Configure a Domain name for the Zabbix Server
- Configure SSL for Zabbix Server Front end
- Configure Firewall
- Install Zabbix Agent on Same Network as Zabbix Server
- Install Zabbix Agent (Active) on a Windows Host Behind a Firewall
- Install Zabbix Agent on CentOS on a different Cloud Provider
- Zabbix Agent Auto Registration
- Enable PSK Encryption for Zabbix Agents
- Creating Host Items
- Creating Host Triggers
- Set up the Email Media Type
- Creating Host Graphs
- Convert Host Items, Triggers and Graphs To A Template
- Template Dashboards
- Global Dashboards
- Creating a Network Map
- Reading Windows Event Logs
- Item Preprocessing with Regex
- Item Preprocessing with JavaScript
- Remote HTTP monitoring using Web Scenarios
- JSON API Monitoring with the HTTP Agent Item
- Log File Monitoring – Apache/Nginx HTTP Status Codes
- Dependent Items
- Execute Bat File on Remote Windows Host with Zabbix Agent
- Execute a Shell Script using Zabbix Agent
- User Defined Parameters
- Calculated Items
- Global Scripts
- Zabbix Server Health
- Users, Groups & Roles
- Install and Configure Zabbix Proxy
- Configure Zabbix Agent on the Zabbix Proxy
- Enable PSK Encryption for Zabbix Proxy
- Reconfigure Zabbix Agents to use Zabbix Proxy
- Install Zabbix Agent on MacOS Behind the Proxy
- Zabbix Proxy Health
- Monitor SNMP Devices
- Setup SNMP Hosts in Zabbix
- Query SNMP Hosts using OIDs
- Query SNMP Hosts using MIBs
- Set up a Network Discovery Rule and Action to Auto Configure SNMP Devices
- Setup SNMP Traps
- Triggers on SNMP Traps
- Creating Custom Low Level Discovery Rules – Part 1
- Creating Custom Low-Level Discovery Rules – Part 2
Dynatrace - Unified Observability, Security and Analytics
Course Details - Dynatrace - Unified Observability, Security and Analytics
Introduction to Dynatrace
- Create an account with Dynatrace
- Logging to Dynatrace
- Deploy Dynatrace OneAgent
Observability before Dynatrace
- Practice Lab: Manually Analyzing Application Behavior
- Practice Lab: Investigate many traces and find bottlenecks
Infrastructure Observability
- Host Performance data
- Host Problems monitoring
- Types of Dynatrace Problems monitoring
- Host availability
- Host Processes monitoring
- Host Events
- Host Logs
- Quick tip on the Timeframe selector
- Full Stack vs Instrastructure Only Monitoring
- Frequent Issues feature
- Renaming your host
- Exclude specific Disks and Network traffic from monitoring
- Network Monitoring
Cloud Automation
- Cloud Automation intro
- Releases
- Service-level objectives
- Creating a new SLO
Application Observability
- Web applications – Performance Analysis
- Web applications – User Behaviour Analysis
- Web applications – Waterfall Analysis tool
- Hyperlyzer – Show Top Findings
- Mobile applications – User Experience metrics
- Mobile applications – Web Requests metrics
- Mobile applications -crashes and errors
- Mobile applications – data privacy
- Mobile App Settings – General settings
- Service monitoring
- Database monitoring
Other Useful Features
- Dynatrace Hub
- Explore the Manage Menu options – Status, Notifications, Access Tokens and more
- Metrics overview
- Reports
Dynatrace SaaS vs Dynatrace Managed
- What is Dynatrace Managed
- What is Dynatrace SaaS
- What is the main difference in terms of capabilities
- How can you migrate from Dynatrace Managed to SaaS
Dynatrace Latest Interface Platform Overview
- Overview of the Interface
- Explore live demo tenant
- The Dynatrace Playground option
Dynatrace Platform core components
- Overview of the Dynatrace solutions and components
- AutomationEngine
- AppEngine
- Smartscape
- Davis AI
- Grail
- Unified Ingest
- PurePath
- OneAgent
Infrastructure Observability
- Clouds observability
- Databases observability
- Infrastructure and Operations
- Kubernetes
- Kubernetes Classic
- AWS monitoring in Dynatrace
- Azure monitoring in Dynatrace
- Cloud Foundry
- Containers monitoring
- Extensions monitoring with Dynatrace
- Extensions – clearing the confusion
- Technology Overview
Application Observability
- Distributed Traces Classic
- Distributed Tracing (new)
- Multidimensional analysis overview (request from your admin if you don’t see it)
- Multidimensional analysis – Top web requests
- Multidimensional analysis – Top database statements
- Multidimensional analysis – Exception analysis
- Multidimensional analysis – create analysis from scratch (part 1)
- Multidimensional analysis – create analysis from scratch (part 2)
- Multidimensional analysis – create analysis from scratch (part 3)
- Profiling and optimization overview
- CPU profiling
- Process crashes
- Services and Services Classic
- Message queues
Dynatrace AI Observability
- Intro to Dynatrace AI Observability
- The AI Observability interface
- Overview of AI observability
- Errors
- Traffic and Latency
- Cost of AI
- Guardrails
- AI Dashboards in Dynatrace intro
- Azure OpenAI
- Google Gemini
- NVIDIA
- OpenAI
- Kong AI
- Prompt Audit Trail
- AI Model Versioning and comparison
Davis CoPilot
- What is the Dynatrace Davis CoPilot
- Example of how you can use Davis CoPilot
- Writing queries with AI
- Using AI to explain Dynatrace capabilities
- Davis CoPilot AI for root cause analysis for problems and resolution
- Using ChatGPT to extend functionality
- Using AI to understand configuration steps for Dynatrace
- Quick Tip – previous Davis CoPilot conversations
Application Security
- Security Overview
- Third-party vulnerabilities
- Code-level vulnerabilities
- Attacks
- Vulnerabilities (NEW)
- Security Posture Management
- Threats & Exploits (NEW)
- Security Investigator
Digital Experience
- Session segmentation
- Session segmentation – filtering for better analysis
- Individual Session deep dive
- Query user sessions
- Synthetic monitoring overview (Classic)
- Setup synthetic monitoring – let’s practice
- TIP – Quickly create additional similar monitors
- Synthetic monitoring – create a clickpath monitor
- Synthetic monitoring – explore all setting options
- Experience Vitals
- Error Inspector
- Synthetic monitoring (NEW)
- Opportunity Insights
Observer and Explore – Notebooks and DQL (Dynatrace Query Language)
- Notebooks intro
- Create our first notebook using DQL (Dynatrace Query Language)
- Create our first notebook part 2 – using DQL to fetch, filter, limit, etc data
- Notebooks – continue learning Dynatrace Query Language (DQL)
- DQL – contains, comments, endswith
- DQL – OR, filtering out, summarize results, timeseries, CountIF
- DQL – Visualizations
- Notebook Markdown
- Editing Notebook sections
- DQL – Sampling data
- DQL – Bin data for better analysis
- DQL – best practice on query structure
- TIP – DQL reference
Observe and Explore – Data Explorer
- Data Explorer intro – create metric visualization and publish to Dashboard
- Data Explorer – creating multiple metrics
- Data Explorer – creating a Kubernetes metric
- Problems app
Create a Dynatrace Dashboard from scratch
- Overview of the real-world Use Case for Kubernetes Dashboard
- Creating our first Dashboard
- Metric 1 – Kubernetes number of nodes
- Metric 2 – Kubernetes allocatable nodes CPU
- Metric 3 – CPU usage by Node
- Metric 4- Allocatable Memory
- Cloning metrics and fixing metric issues
- Adding additional metrics to the Dashboard
- Creating a complex metric using Advanced Mode
- Finalizing the Dashboard
- Dashboard tags
- Dashboards – export, import, filtering
- Dynamic filters
- Manage access options
- General Dashboard settings
- Preset settings
- Adding images – URL pattern rules for dashboards
Logs and Events in Dynatrace
- The Logs and Events Viewer
- Logs and Events analysis in simple mode
- Logs and Events analysis in advanced mode
- Logs (NEW)
Business Observability
- Business Flow
- Cost and Carbon Optimization
- Explore Business Events
Automation – Site Reliability Guardian and Workflows
- Create your first Site Reliability Guardian
- Validating our Guardian
- Editing the Guardian
- Automating your Guardian with the Workflows App
Dynatrace Smartscape Topology
- Smartscape Topology deep dive
Dynatrace Administration
- Intro to Dynatrace administration
- Create teams to own Dynatrace monitored entities
- Assign teams to monitor a particular host, etc
- Checking your OneAgent health
- OneAgent updating – setup a maintenance window
- Setup problem alerting profiles
- Setup vulnerability and attack alerting profiles and integrate with webhook
- Email integration for security and vulnerability alerts
- JIRA integration for vulnerability and security alerts
- Data Privacy Settings – important due to legislations
- Generate access tokens
- Generate personal access tokens
- Credential Vault
- Discovery and Coverage (NEW)
Dynatrace Account Management
- Dynatrace Account Management overview
- Dynatrace License usage overview
- Invite and assign users’ permissions and access
- Create and manage groups for Dynatrace access
- Define Dynatrace policies
- Options available to configure corporate credentials for authentication
- Dynatrace adoption metrics
- Environment lens
- Other settings
- Updating your profile and environment notifications
Dynatrace Competitors
- Datadog vs Dynatrace
- New Relic vs Dynatrace
- AppDynamics vs Dynatrace
- Splunk vs Dynatrace
- Elastic Observability vs Dynatrace
- Amazon CloudWatch vs Dynatrace
- Instana Observability (IBM) vs Dynatrace
Dynatrace Official Certifications
- Intro to Dynatrace certifications
- Dynatrace Associate Certification
- Dynatrace Advanced Automation Specialist Certification
- Dynatrace Advanced Observability Specialist Certification
- Dynatrace Advanced Security Specialist Certification
- Dynatrace DEM and Business Analytics Specialist Certification
- Dynatrace Application Development Specialist Certification
- Dynatrace Implementation Professional Certification
- Dynatrace Administration Professional Certification
- Dynatrace Ambassador Certification
Dynatrace is a unified monitoring & Observability tool to monitor your Applications & Infrastructure using Dynatrace . Dynatrace collect time-series metrics like CPU ,memory, network traffic, servers logs & other metrics from network & infrastructure servers using its monitoring & other pre-built tools available & then visualize them on customized dashboards in form of graphs & bar charts. We can also bring insights from time-series data using pre-built QL language that will help to filter out and aggregate metrics streams for a particular time range . It uses interactive Data visualization and Monitoring dashboards will help users to create dynamic dashboards to visualize metrics, logs, and traces collected from servers (Application, Databases & others).

Hashicorp Terraform Certification Course
Advance your career in Terraform (Cloud Infrastructure Provisioning) through certification training that teaches Infrastructure as Code (IaC) automation using HashiCorp Terraform templates. Master provisioning infrastructure across hybrid cloud platforms like AWS, Azure, GCP, and others, while integrating seamlessly with DevOps pipelines to dynamically spin up resources at runtime before deployments

Monitor a microservices app through a monitoring pipeline with Jenkins K8s, Grafana & Datadog artifacts.
Project Description : Applications contain 20+ microservices that will be packaged into containers & pushed it to Container Registry (AWS ECR & Azure Container Registry) automatically through the CI/CD pipeline integrates with Terraform scripts that will snip the infrastructure at runtime & also helped the apps to be deployed into higher environments (UAT, Stage & above).
Also Terraform manages the end-to-end Infrastructure deployment life cycle using Terraform workflow and IaC templates. Application will be integrated to Grafana dashboards & Prom QL scripts to capture metrics & logs from apps.
Project 2
Service MESH Integration within K8S using Side Car Pattern & publish them using Grafana Dashboards
Application containers deployed on K8s will be monitored using proxy containers injected by Istio Daemon that will receive continuous health checks of the running containers via monitoring pipeline & publish them on Grafana dashboards while aggregated the metric using PromQL tool of Prometheus. Telemetry traces of Pods will be displayed using Jaeger dashboard & the request response along with failure will be detected using Kiali that also monitors the traffic management across the containers.
Hours of content
Live Sessions
Software Tools


After completion of this training program you will be able to launch your carrer in the world of Monitoring being certified as Grafana & Prometheus Engineers Professional. With the Grafana & Prometheus Engineers Professional Certification in-hand you can boost your profile on Linked, Meta, Twitter & other platform to boost your visibility

- Get your certificate upon successful completion of the course.
- Certificates for each course


Designed to provide guidance on current interview practices, personality development, soft skills enhancement, and HR-related questions

Receive expert assistance from our placement team to craft your resume and optimize your Job Profile. Learn effective strategies to capture the attention of HR professionals and maximize your chances of getting shortlisted.

Engage in mock interview sessions led by our industry experts to receive continuous, detailed feedback along with a customized improvement plan. Our dedicated support will help refine your skills until your desired job in the industry.

Join interactive sessions with industry professionals to understand the key skills companies seek. Practice solving interview question worksheets designed to improve your readiness and boost your chances of success in interviews

Build meaningful relationships with key decision-makers and open doors to exciting job prospects in Product and Service based partner

Your path to job placement starts immediately after you finish the course with guaranteed interview calls
Why should you choose to pursue a Infrastructure Engineer course with Success Aimers?
Success Aimers teaching strategy follow a methodology where in we believe in realtime job scenarios that covers industry use-cases & this will help in building the carrer in the field of DevOps & monitoring tools (Grafana & Prometheus) also delivers training with help of leading industry experts that helps students to confidently answers questions confidently & excel projects as well while working in a real-world
What is the time frame to become competent as a Infrastructure Engineer?
To become a successful Grafana & Prometheus Engineer required 1-2 years of consistent learning with dedicated 3-4 hours on daily basis.
But with Success Aimers with the help of leading industry experts & specialized trainers you able to achieve that degree of mastery in 6 months or one year or so and it’s because our curriculum & labs we had formed with hands-on projects.
Will skipping a session prevent me from completing the course?
Missing a live session doesn’t impact your training because we have the live recorded session that’s students can refer later.
What industries lead in Monitoring Tools (Grafana, Prometheus, Datadog, Dynatrace, Zabbix & others) implementation?
Manufacturing
Financial Services
Healthcare
E-commerce
Telecommunications
BFSI (Banking, Finance & Insurance)
“Travel Industry
Does Success Aimers offer corporate training solutions?
At Success Aimers, we have tied up with 500 + Corporate Partners to support their talent development through online training. Our corporate training programme delivers training based on industry use-cases & focused on ever-evolving tech space.
How is the Success Aimers Infrastructure Engineer (Grafana & Prometheus) Certification Course reviewed by learners?
Our Infrastructure Engineer (Grafana & Prometheus) Certification Course features a well-designed curriculum frameworks focused on delivering training based on industry needs & aligned on ever-changing evolving needs of today’s workforce due to AI-based monitoring tools. Also our training curriculum has been reviewed by alumi & praises the thoroguh content & real along practical use-cases that we covered during the training. Our program helps working professionals to upgrade their skills & help them grow further in their roles…
Can I attend a demo session before I enroll?
Yes, we offer one-to-one discussion before the training and also schedule one demo session to have a gist of trainer teaching style & also the students have questions around training programme placements & job growth after training completion.
What batch size do you consider for the course?
On an average we keep 5-10 students in a batch to have a interactive session & this way trainer can focus on each individual instead of having a large group
Do you offer learning content as part of the program?
Students are provided with training content wherein the trainer share the Code Snippets, PPT Materials along with recordings of all the batches

Advanced DevOps Training Course in Noida Monitor & Observe your Applications & Infrastructure using Grafana,...
Advanced DevOps Training Course in Chennai Monitor & Observe your Applications & Infrastructure using Grafana,...
Advanced DevOps Training Course in Delhi Monitor & Observe your Applications & Infrastructure using Grafana,...
Advanced DevOps Training Course in Faridabad Monitor & Observe your Applications & Infrastructure using Grafana,...
Advanced DevOps Training Course in Hyderabad Monitor & Observe your Applications & Infrastructure using Grafana,...
Advanced DevOps Training Course in Kolkata Monitor & Observe your Applications & Infrastructure using Grafana,...
Advanced DevOps Training Course in Mumbai Monitor & Observe your Applications & Infrastructure using Grafana,...
Advanced DevOps Training Course in Noida Monitor & Observe your Applications & Infrastructure using Grafana,...
Advanced DevOps Training Course in Mumbai Monitor & Observe your Applications & Infrastructure using Grafana,...
DevOps Engineer Masters Program in Chennai Automate Deployment & Containerize Apps using Jenkins, K8s, Ansible...
DevOps Engineer Masters Program in Delhi Automate Deployment & Containerize Apps using Jenkins, K8s, Ansible...
DevOps Engineer Masters Program in Faridabad Automate Deployment & Containerize Apps using Jenkins, K8s, Ansible...
DevOps Engineer Masters Program in Gurgaon Automate Deployment & Containerize Apps using Jenkins, K8s, Ansible...
DevOps Engineer Masters Program in Hyderabad Automate Deployment & Containerize Apps using Jenkins, K8s, Ansible...
DevOps Engineer Masters Program in Kolkata Automate Deployment & Containerize Apps using Jenkins, K8s, Ansible...